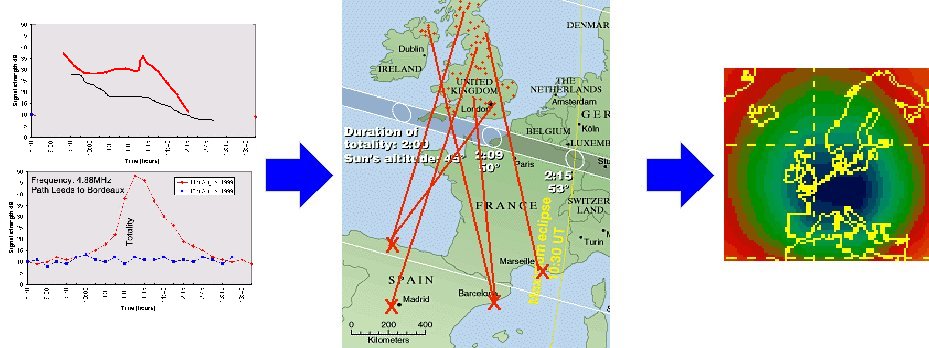
Putting everyone's observations together
Signal strength data from all the links can be turned into a contour plot of the changes in the ionosphere across the region.
|
How to do some radio experiments
|
Back to Radio Experiments
|
14/10/98
Ruth Bamford
 Putting
everyone's observations togetherPutting
everyone's observations together
Putting
everyone's observations togetherPutting
everyone's observations together