RISER events
We have identified several events we want to study in the RISER project, summarised below, in table and visual forms.
These events have been selected as times where space weather has caused enhanced geomagnetic activity on Earth, characterised using the Kp index, and where interplanetary scintillation (IPS) observations are available.
Context for RISER event selection
Geomagnetic enhancements have been used as the basis for RISER event selection as they can have impacts on Earth and human technology (e.g. potentially causing power grid issues). They arise when Earth's magnetic field gets disturbed by the arrival of structures launched from the sun, notably coronal mass ejections (CMEs) and corotating interaction regions (CIRs).
Not all CMEs and CIRs cause significant geomagnetic disturbances: understanding which ones have the potential to cause problems is a key issue for space weather research.
Current observation sources and modelling approaches used operationally, based on observations of the sun and its environs, give some advance warning (typically 3-4 days) of the presence of Earthbound CMEs or CIRs. However there are long intervals on their passage to Earth where these structures are not monitored operationally. And it is only only when they reach satellites at the L1 Lagrangian point, 99% of the way to Earth, that their potential impact becomes clearer. This gives only about 1 hour of warning, insufficient for most practical purposes.
The RISER project is exploring whether using IPS observations to remote sense the undermonitored region between the sun and Earth can help matters. IPS observations may allow an improved monitoring of CME and CIR structures, and the overall solar wind they travel in, and may also allow forecasting of impacts before these structures reach L1.
Specifically, for the events here, RISER is seeking to explore how additional IPS observations from the LOFAR radio telescope can complement existing IPS measurements from the ISEE radio telescope, and let us better characterise CME and CIR structures, and forecast their impacts on Earth.
In order to translate any resulting research outcomes from RISER into space weather operations it is vital that any associated diagnostics can be provided accurately, robustly, and rapidly - far enough in advance to provide useful and actionable forecasts for affected sectors. To explore the potential for operational use, RISER will not only run the IPS modelling systems in near-real time, but will also seek to verify its performance, both on the historic events below (running the systems in "hindcast" mode), but also on any new events which occur during the near-real time runs.
We also want to understand how forecasts of CMEs and CIRs using IPS compare overall to existing operational ways of forecasting these structures. By benchmarking the forecast performance of IPS-based approaches, we can understand if this has potential as a complementary observation source, worthy of further investment to integrate into the operational space weather observing system.
Events
The table below records the various events of interest which have some level of IPS data availability, whether from the ISEE or LOFAR radio telescopes, or the spaceborne SMEI instrument.
For each event we record:
- ID
- an associated identifier
- Kp
- the maximum Kp occurring during the event
- Event start
- the first 3H interval for the event where Kp >= 5
- Event start
- the last 3H interval for the event where Kp >= 5
- Type
- whether catalogues suggest a CME is present, or if a CIR cause is presumed
| ID | Kp | Event start | Event end | Type |
|---|---|---|---|---|
| R01 | 8 | 2024-03-23T21Z | 2024-03-24T18Z | CME |
| R02 | 6 | 2023-09-19T00Z | 2023-09-25T00Z | CME |
| R03 | 5 | 2019-08-31T09Z | 2019-09-01T12Z | CIR |
| R04 | 5 | 2020-09-24T06Z | 2020-09-27T21Z | CIR |
| R05 | 5 | 2018-11-04T21Z | 2018-11-05T03Z | CIR |
| R06 | 8 | 2017-09-08T00Z | 2017-09-08T12Z | CME |
| R07 | 8 | 2012-03-09T06Z | 2012-03-09T06Z | CME |
| R08 | 7 | 2015-03-17T12Z | 2015-03-17T21Z | CIR |
| R09 | 7 | 2011-08-05T18Z | 2011-08-06T00Z | CME |
| R10 | 7 | 2010-04-05T09Z | 2010-04-05T09Z | CME |
| R11 | 6 | 2011-05-28T06Z | 2011-05-28T12Z | CME |
| R12 | 6 | 2010-08-03T21Z | 2010-08-04T18Z | CME |
| R13 | 6 | 2011-09-26T15Z | 2011-09-26T18Z | CIR |
| R14 | 6 | 2008-09-04T03Z | 2008-09-04T03Z | CME |
| R15 | 6 | 2008-10-11T15Z | 2008-10-11T15Z | CIR |
| R16 | 6 | 2010-05-02T12Z | 2010-05-02T12Z | CIR |
| R17 | 6 | 2011-06-05T00Z | 2011-06-05T00Z | CME |
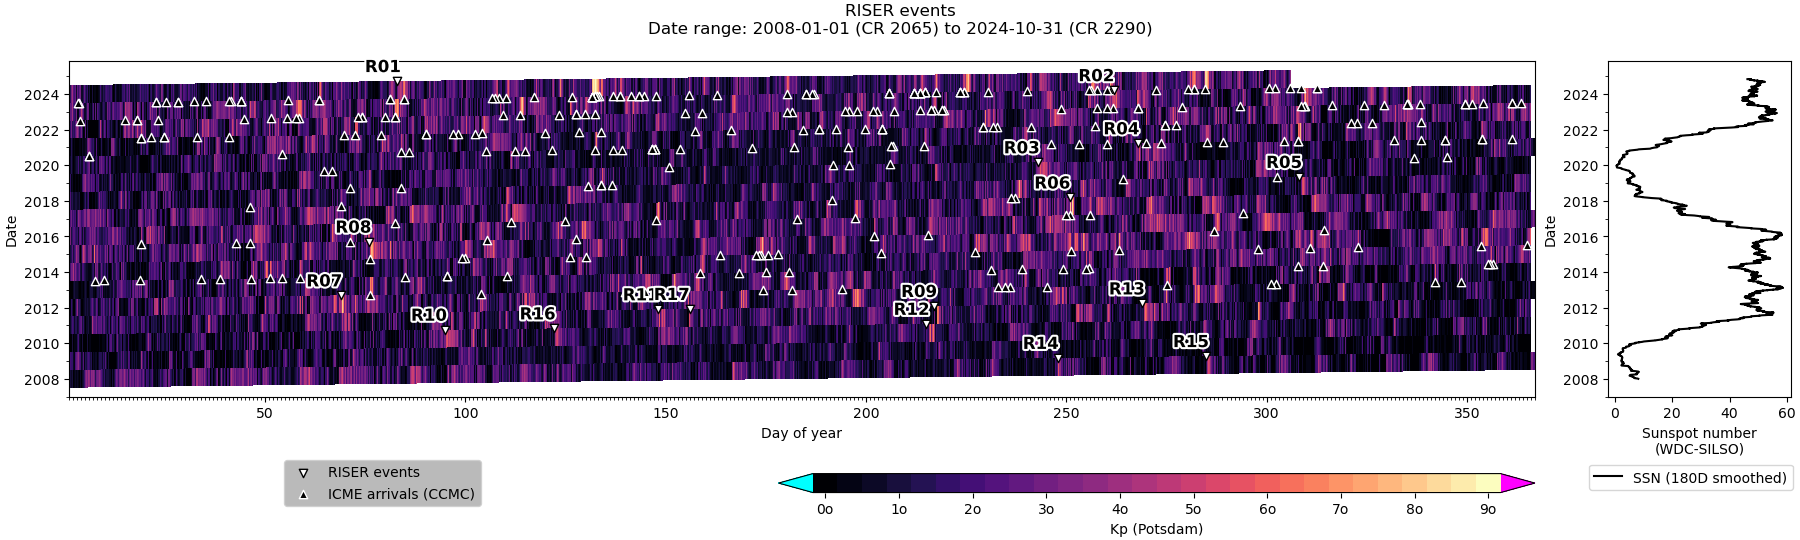
Annual cycle view of the events
The image below gives a summary of the RISER events across the years.
Examining events by Earth-based calendar years is useful for considering terrestrial factors, such as the Russell-McPheron effect which enhances the geoeffectiveness of Earth-impacting solar structures at the spring and autumn equinoxes.
It is also useful for considering factors such as data availability: currently IPS measurements from the ISEE radio telescope in Japan are typically unavailable during the winter months from October to March, when the telescopes are often covered by snow.
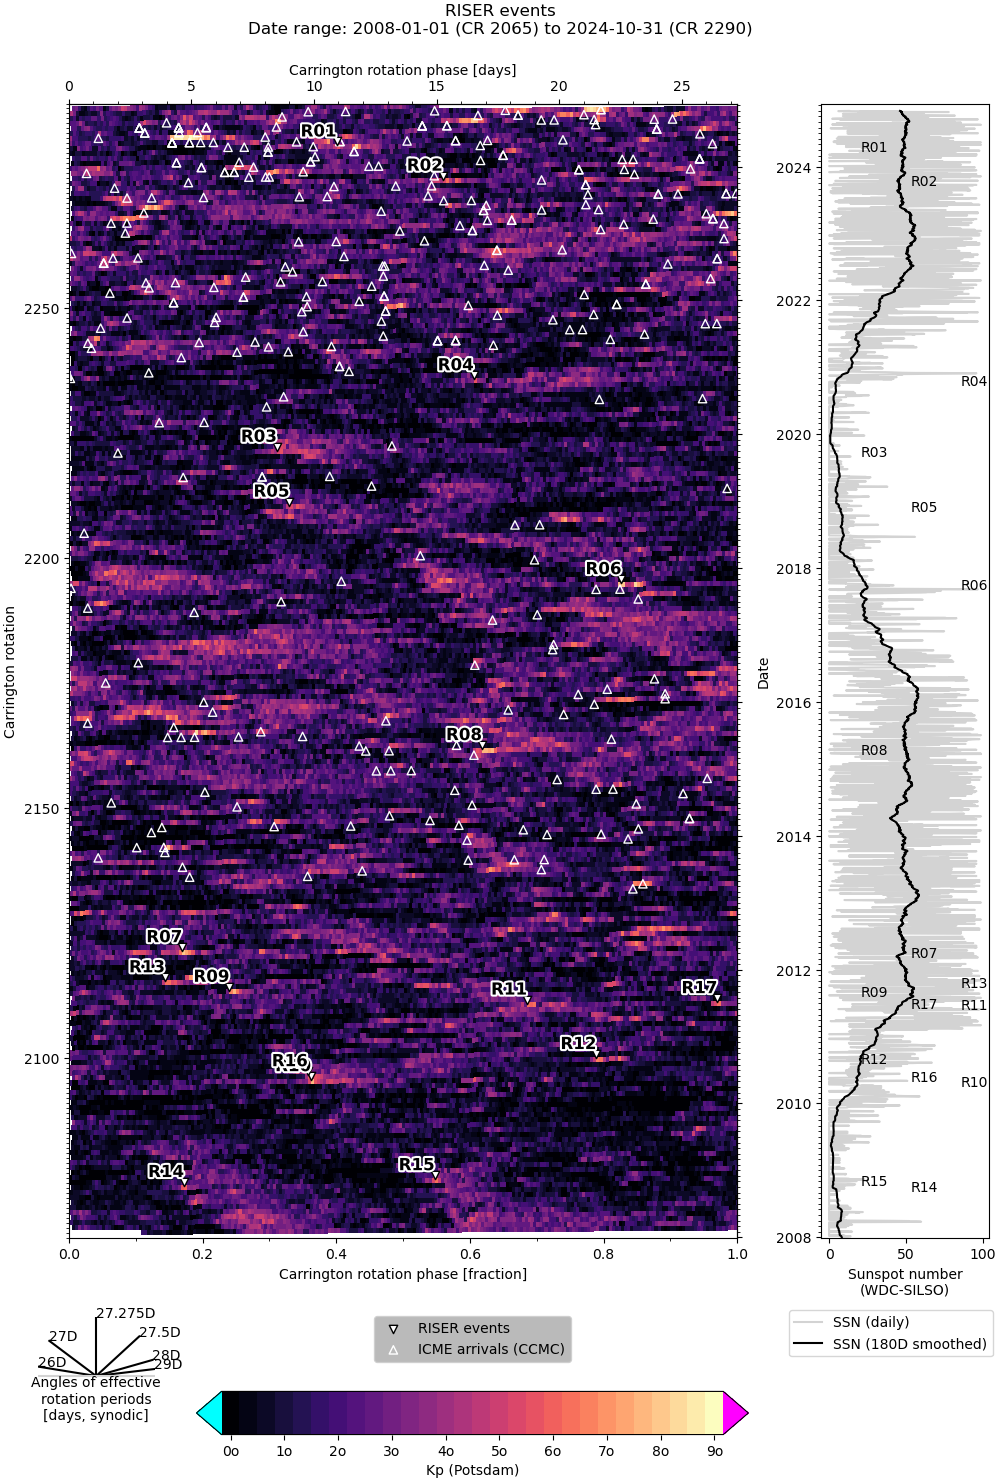
Carrington rotation view of the events
Another good way of reviewing the RISER events is via a Carrington rotation plot.
This is useful for considering the events on solar timescales - in this view, the events and associated Kp data are organised by the Carrington rotation rate of 27.2753 days, corresponding to the typical rotation rate of the sun near the equator (the sun rotates slower near the poles). This helps differentiate events associated with slowly-evolving solar conditions (such as CIRs), which show up as recurring "clouds" of activity, versus more transient events associated with rapid solar dynamics, such as CMEs, which show up as horizontal streaks.
Citations
We gratefully acknowledge the use of the following observations and key Python-based software in creating the RISER event overview figures:
- Kp (Potsdam) and sunspot number (WDC-SILSO) data: aggregated by the Geomagnetic Observatory Niemegk, GFZ German Research Centre for Geosciences, Potsdam (Matzka et al, 2021a, 2021b; Clette & Lefevre, 2016). Data retrieved from https://kp.gfz-potsdam.de/en/data on 2024-11-13
- ICME shock arrival times at L1: we acknowledge the Community Coordinated Modeling Center (CCMC) at Goddard Space Flight Center for the use of the CME arrival time scoreboard, https://ccmc.gsfc.nasa.gov/scoreboards/cme (Kay et al, 2024, Riley et al, 2018). Data retrieved from the CCMC CME scoreboard API on 2024-11-15
- Observation processing: version 2.2.3 (https://doi.org/10.5281/zenodo.13819579) of pandas (McKinney, 2010), and version 2.1.2 of numpy (Harris et al, 2020)
- Carrington rotation & synodic period calculations: version 6.0.3 (https://doi.org/10.5281/zenodo.13948147) of the SunPy open source software package (The SunPy Community et al, 2020), and version 6.1.4 (https://doi.org/10.5281/zenodo.13860849) of astropy (The Astropy Collaboration et al, 2022)
- Subplot mosaic layouts & secondary axis transforms (Carrington rotation to date): version 3.9.2 (https://doi.org/10.5281/zenodo.13308876) of Matplotlib (Hunter, 2007)
References
- Matzka, J., Stolle, C., Yamazaki, Y., Bronkalla, O. and Morschhauser, A. (2021a). The geomagnetic Kp index and derived indices of geomagnetic activity. Space Weather, https://doi.org/10.1029/2020SW002641
- Matzka, J., Bronkalla, O., Tornow, K., Elger, K., Stolle, C. (2021b). Geomagnetic Kp index. V. 1.0. GFZ Data Services, https://doi.org/10.5880/Kp.0001
- Clette, F., Lefevre, L., 2016. The New Sunspot Number: assembling all corrections. Solar Physics, 291, https://doi.org/10.1007/s11207-016-1014-y
- Kay et al. (2024). Updating Measures of CME Arrival Time Errors. Space Weather, 22. https://doi.org/10.1029/2024SW003951
- Riley et al. (2018). Forecasting the arrival time of coronal mass ejections: Analysis of the CCMC CME scoreboard. Space Weather, 16, 1245-1260. https://doi.org/10.1029/2018SW001962
- McKinney (2010). Data Structures for Statistical Computing in Python. Proceedings of the 9th Python in Science Conference, Volume 445, https://doi.org/10.25080/Majora-92bf1922-00a
- Harris et al (2020). Array programming with NumPy. Nature 585, 357–362. https://doi.org/10.1038/s41586-020-2649-2
- The SunPy Community et al (2020). The SunPy Project: Open Source Development and Status of the Version 1.0 Core Package. ApJ, 890, 68, https://doi.org/10.3847/1538-4357/ab4f7a
- The Astropy Collaboration et al (2022). The Astropy Project: Sustaining and Growing a Community-oriented Open-source Project and the Latest Major Release (v5.0) of the Core Package. ApJ, 935 167, https://doi.org/10.3847/1538-4357/ac7c74
- Hunter (2007). Matplotlib: A 2D Graphics Environment. Computing in Science & Engineering, 9, 3, 90-95. https://doi.org/10.1109/MCSE.2007.55