GBDC - Auroral Oval Indicators
Generate Auroral Oval Indicator Plots
Three new auroral activity indicators are being created. Each indicator uses
a ring of magnetometer stations, roughly following a line of geomagnetic
latitude. The value of an indicator is determined in a similar manner to the
existing AL index: specifically, an indicator is derived by superimposing the
horizontal component of the magnetometer traces from the participating
stations, and taking the lower envelope. In addition to this, the longitude of
the particular station whose reading provides the indicator value at any time
is also recorded.
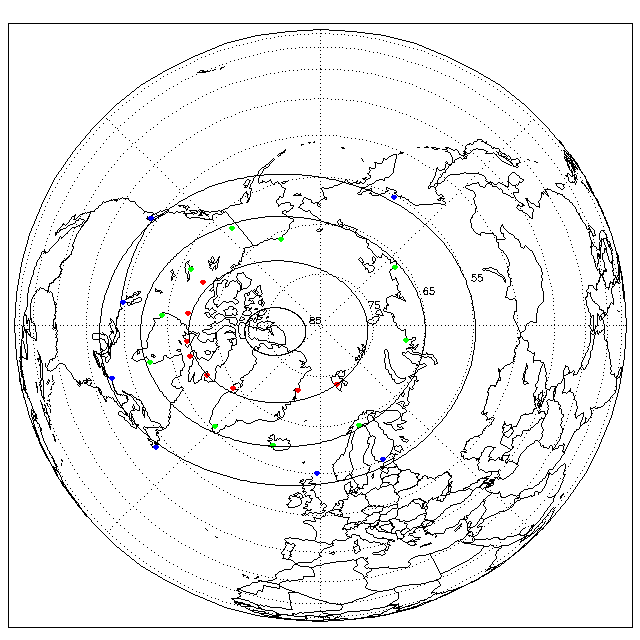
The intended contributing stations are shown on the following sensitive map of
the northern hemisphere.
The colours for the stations indicate on which oval the station lies.
- Red - Contracted oval
- Green - Standard oval
- Blue - Expanded oval
and the rings show lines of geomagnetic latitude. If you click on the map you
will get the details of the station closest to the point at which you clicked.
There is also a table of all the
stations.
The indicators will be produced with whatever data there is available; we will
not wait until all contributing stations have supplied their data before
calculating the indicator values, thus there should be enough data to get
preliminary values within 3 to 4 weeks. As more data arrives the indicators
will be recalculated, but final values might not be available until 6 to 12
months after the event.
You can now
generate indicator plots with the currently
available data.
GBDC |
Instruments
04-SEP-2008 Sarah James